 |
UltraCAD Design, Inc |

Download here (Unzip after downloading)
.
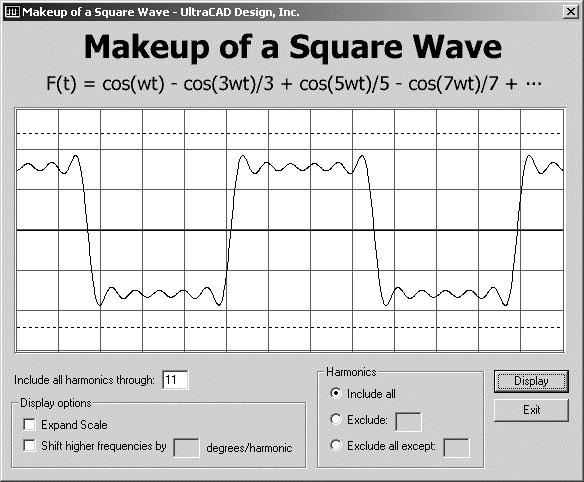
This simulation can suggest what happens if the circuit does not pass all of the harmonics equally well, and helps you visually understand the makeup of a square wave. Start by entering a number for the “Include all harmonics through:” box. The number 11 is a reasonable place to start. Then press Display. The graph shows the fundamental frequency and the first eleven harmonics following that. (Note that only the odd harmonics enter into this relationship, so the first eleven harmonics only add five harmonics above the fundamental to the equation.) The curve looks like a square wave, but it is not perfect.
Change the number of harmonics to see the effect on the shape of the curve. Determine what you feel is an acceptable approximation to a square wave and see how many harmonics are included. It is that many harmonics the system must be able to deal with, without distortion, to produce the curve you think is acceptable.
This simulation allows you to experiment in some other ways, too. For example, select some number of harmonics and look at the waveform. Then select the Exclude button and enter the number of a harmonic to exclude from the equation. Then select Display. Note how the waveform distorts. This type of thing could happen, for example, if somehow a filter existed in the circuit at the frequency you just selected that acted to “kill” that particular harmonic. That filter could happen inadvertently, or it could exist as a result of parasitics that no one knew about or expected. This is an insidious problem that can be very difficult to diagnose. (Note that if you exclude an even harmonic nothing happens because even harmonics are not contained in the series relationship.)
If you select the Exclude all except option, you can look at the relative magnitude of any individual harmonic.
The Expand Scale option allows you to see a close-up view of the rise time of the waveform. It expands the display in the approximate area of the fifth vertical grid line. This allows you to see a close-up view of any distortion or ringing associated with the rising edge.
The Shift higher frequencies by option will add an increasing phase shift XE "Phase angle, shift:Square Wave Simulator" to each harmonic. Suppose the circuit has some capacitive loading. The capacitive loading can cause a negative voltage phase shift (voltage lags current). If you enter a negative number in the box, each harmonic will be shifted by a multiple of this phase shift. Try these numbers: Enter 99 for the number of harmonics to include and –4 for the shift. Then select Display. The display looks almost exactly like the ringing that is common in many circuits.
Caution: The Shift higher frequency by option does not really reflect real-world conditions. I have included it to suggest some effects, but a real-world phase shift would be much more complicated than this. Treat this particular feature as interesting, but not necessarily representative.
.